RSI(相対力指数)
RSIの使い方と勝率を上げるコツ:ダイバージェンスまで徹底解説
・RSIの正しい計算式と「買われすぎ・売られすぎ」の本質
・単なる数値で判断しない、レジスタンスラインを組み合わせた実戦術
・トレンド転換の予兆を捉えるダイバージェンスの見方
RSI(Relative Strength Index:相対力指数)は、一定期間の値動きに対して「値上がり幅」と「値下がり幅」がどのような割合を占めているかを数値化したテクニカル指標です。
一般的には「70~80%以上で買われすぎ」「20~30%以下で売られすぎ」と判断し、逆張りの指標として有名ですが、実はその背後にある「勢いの強弱」を理解することが、インデックスされるような質の高い分析には欠かせません。
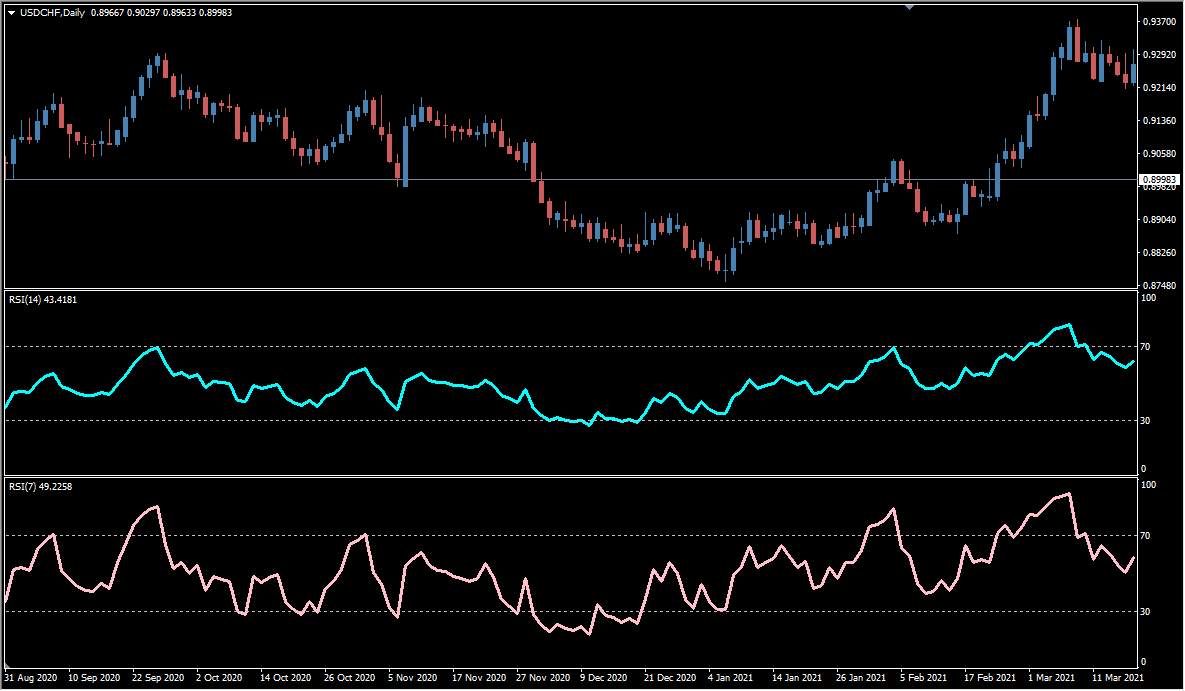
RSIの計算式と期間設定
RSIは、オシレーター系の生みの親であるJ.W.ワイルダー氏によって考案されました。計算式を理解すると、なぜRSIが「0〜100」の間で動くのかが明確になります。
RSIの計算式
RSIは、直近14日間の「上がった強さ」と「下がった強さ」を比較して、
今の相場が買われすぎか/売られすぎかを数値化した指標です。
計算では、次の2つを使います。
- X:直近14日間の「値上がり幅の平均」
- Y:直近14日間の「値下がり幅の平均」
RSI = X ÷(X + Y)× 100
この式は、上昇の勢いが全体の値動きの中でどれくらいを占めているかを%で表しています。
上昇が強いほどRSIは高くなり、下落が強いほどRSIは低くなります。


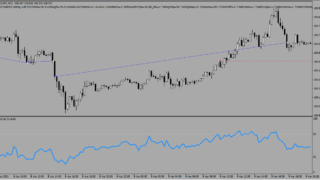
RSIの実戦的な使い方:環境認識をセットにする
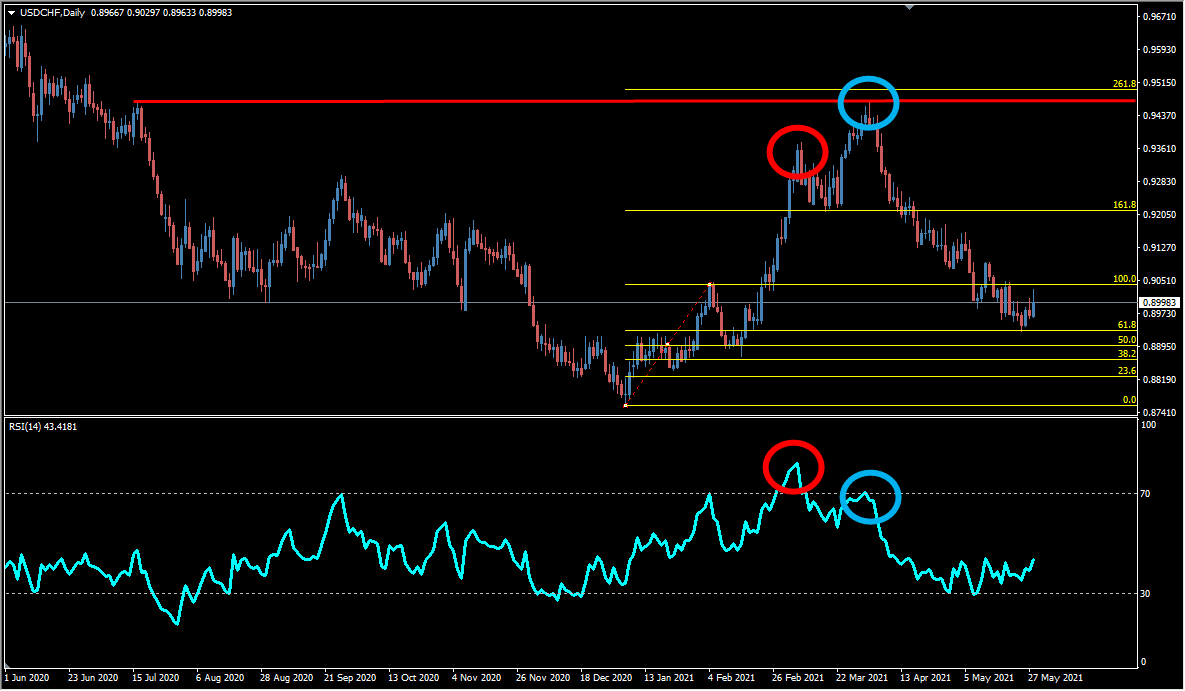
RSIが70%を超えたからといって、すぐに「売り(ショート)」を入れるのは危険です。RSIの精度を劇的に上げるには、「左側の景色(水平線や抵抗帯)」を必ず確認しましょう。
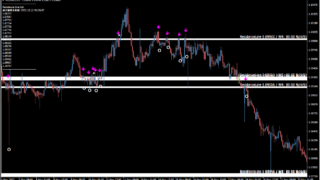
抵抗帯とRSIの合致を確認する
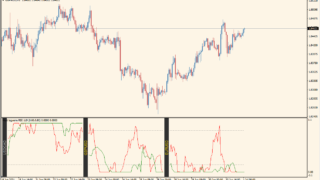
赤丸のポイント:RSIは80%を超えていますが、左側に目立つ抵抗帯がありません。この場合、RSIが高い数値を示し続けながら価格が上昇する「張り付き(バンドウォーク)」が起こりやすく、逆張りは失敗に終わります。
青丸のポイント:ここは左側に大きな下落の起点となった「直近高値」が存在します。意識されるラインとRSIの「買われすぎ」が合致した時こそ、反落を狙う高確率なポイントになります。
トレンド転換を示唆する「ダイバージェンス」
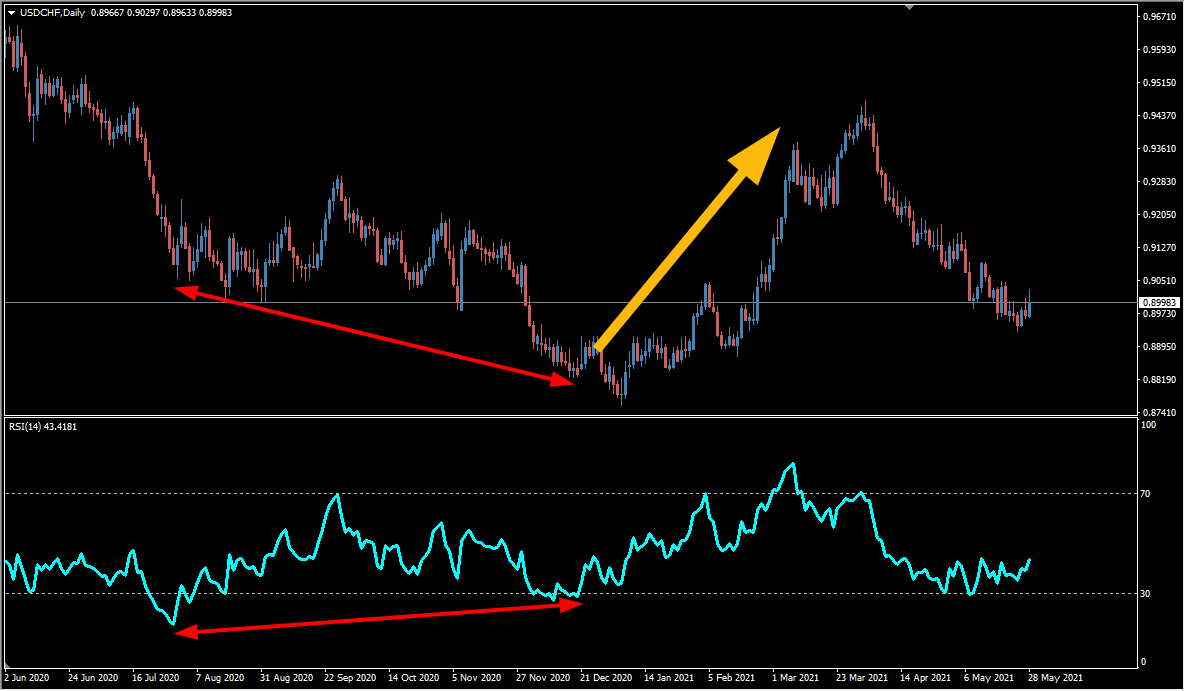
価格は上昇(または下落)しているのに、RSIの数値が逆の方向に動いている現象をダイバージェンス(逆行現象)と呼びます。
これは「価格は更新しているが、上昇・下落の勢いが弱まっている」ことを意味し、強力なトレンド転換のサインとなります。RSI単体で逆張りをするよりも、このダイバージェンスを確認してからエントリーする方が格段に勝率は上がります。
RSIを使用する際の注意点
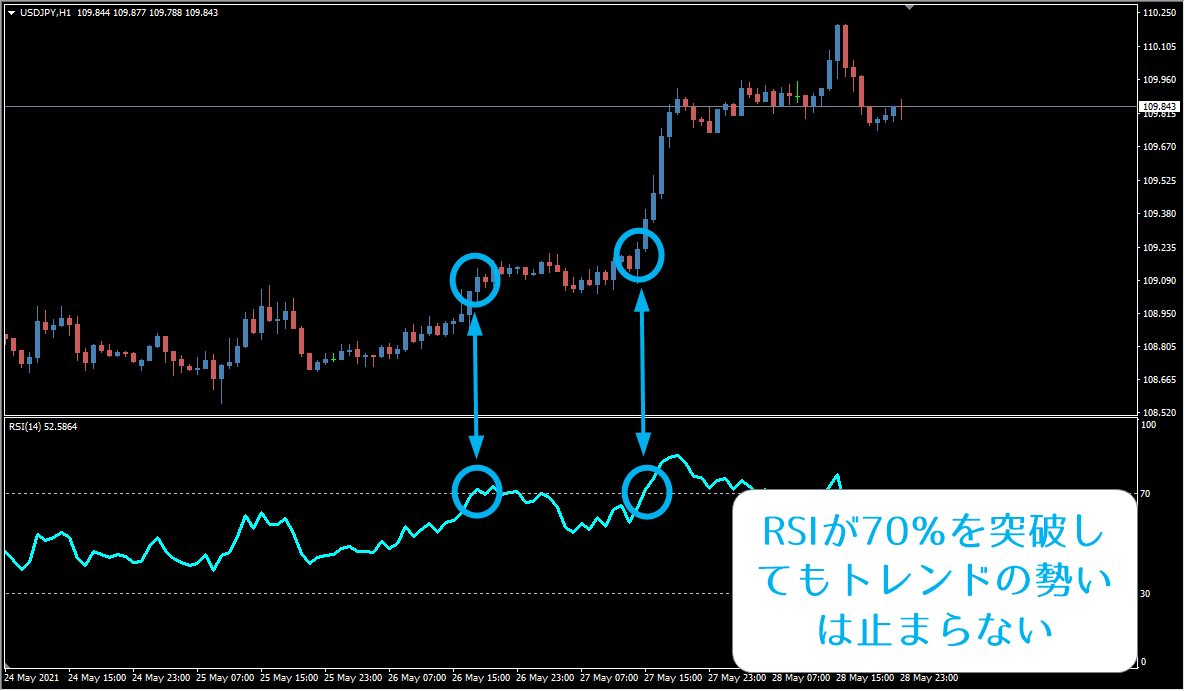
RSIで最も注意すべきは、「強いトレンドの最中には機能しない」という点です。
計算式を思い出してください。14本のローソク足のうち、ほとんどが陽線であればRSIは簡単に80%や90%に到達します。この時、RSIが高い数値にあるのは「買われすぎ」ではなく「上昇トレンドが非常に強い」ことを示しているに過ぎません。
RSIはあくまで「サブ」の指標です。必ずレジスタンスライン、サポートライン、フィボナッチなどの「価格の節目」をメインに据え、それらを補強する根拠として活用してください。
RSIに関するよくある質問(FAQ)
理論上、設定期間(14日間など)のすべてが陽線であれば100、すべてが陰線であれば0になります。しかし、実際の相場では稀であり、100や0に近い数値が出ているときは異常なほど強いトレンドが発生している証拠です。
はい。デイトレードなど短期的な過熱感を見たい場合は「9」を、より長期的な傾向を見たい場合は「25」や「52」を使うトレーダーもいます。まずは基本の「14」で始め、自分の手法に合うものを探すのがベストです。
RSIを拡張する便利なインジケーター集
RSIの機能をさらに拡張したり、アラートを飛ばしたりできるMT4/MT5用のインジケーターを厳選しました。トレードスタイルに合わせて活用してください。
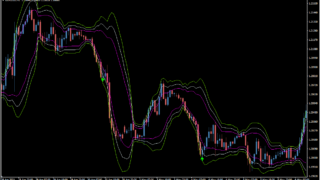
[ボリンジャーバンドとRSIを組み合わせたサインツール]
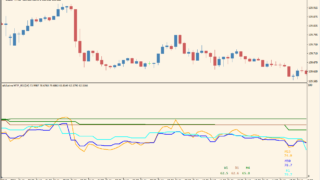
[マルチタイムフレーム(MTF)対応のRSI]
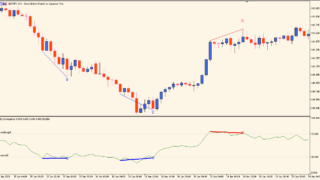
[RSIのダイバージェンスを自動検知するインジ]
[複数の通貨ペアのRSIを一括管理]
[RSIをベースにした高機能EA(自動売買)]